Of course! Using Python to generate ECharts visualizations and embedding them in a Flask web application is a powerful and popular combination. It allows you to create dynamic, data-driven dashboards entirely within the Python ecosystem.

Here’s a complete guide, broken down into steps, with clear explanations and code examples.
The Core Concept
The workflow is straightforward:
-
Flask (Backend):
- Handles web requests (
GET,POST). - Fetches or processes data (e.g., from a database, CSV, or by running a calculation).
- Renders an HTML template, passing the processed data to it.
- Handles web requests (
-
Python ECharts Library (e.g.,
pyecharts): (图片来源网络,侵删)
- This is the bridge. It's a Python library that lets you create ECharts charts using Python syntax.
- It can generate the necessary JavaScript and JSON configuration for an ECharts chart.
-
HTML/JavaScript (Frontend):
- The HTML template (created by Flask) contains a
<div>element where the chart will be rendered. - It includes the
pyechartsJavaScript library (which it generates from your Python code). - It initializes the chart, passing the data and configuration from the Python backend.
- The HTML template (created by Flask) contains a
Step 1: Installation
First, you need to install Flask and the pyecharts library.
pip install Flask
pip install pyecharts
Step 2: Project Structure
A good practice is to organize your project files like this:
/flask-echarts-app
|-- app.py              # Your main Flask application file
|-- /templates
|   |-- index.html      # The HTML template for your main page
|-- /static
|   |-- /js             # (Optional) For custom JS files
|   |-- /css            # (Optional) For custom CSS files
Step 3: Create a Basic Flask App (app.py)
Let's start with a minimal Flask application. This app will define a route and render our index.html template.

# app.py
from flask import Flask, render_template
app = Flask(__name__)
@app.route('/')
def index():
    # We will pass data to the template here later
    return render_template('index.html')
if __name__ == '__main__':
    app.run(debug=True)
Step 4: Create the HTML Template (templates/index.html)
This is where the magic happens. We need to:
- Include the
pyechartsJavaScript library. - Create a
<div>with a unique ID for our chart. - Write a small script to initialize the chart.
Important: pyecharts can automatically generate the required script tags. We just need to include them in the template.
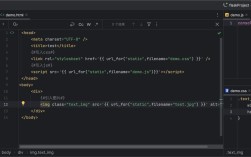
<!-- templates/index.html -->
<!DOCTYPE html>
<html lang="en">
<head>
    <meta charset="UTF-8">Flask & ECharts</title>
    <!-- pyecharts will automatically include its JS files -->
    {{ my_chart.render_embed() | safe }}
</head>
<body>
    <h1>My First Flask-ECharts Chart</h1>
    <div id="chart" style="width:1000px; height:500px;"></div>
    <!-- The script to render the chart -->
    <script>
        // This function is generated by pyecharts
        // my_chart is the variable name we will use in app.py
        my_chart.setOption({
            title: {
                text: 'Sales Data'
            },
            tooltip: {},
            xAxis: {
                data: ['Shirts', 'Cardigans', 'Chiffons', 'Pants', 'Heels', 'Socks']
            },
            yAxis: {},
            series: [{
                name: 'sales',
                type: 'bar',
                data: [5, 20, 36, 10, 10, 20]
            }]
        });
    </script>
</body>
</html>
{{ my_chart.render_embed() | safe }}: This is the key.my_chartis a variable we will pass from Flask.render_embed()generates the<script>and<div>tags needed by ECharts. The| safefilter is crucial in Jinja2 (Flask's templating engine) to prevent it from escaping the HTML/JS content.
Step 5: Generate the Chart in Flask and Pass it to the Template
Now, let's modify app.py to create a bar chart using pyecharts and pass it to the index.html template.
# app.py
from flask import Flask, render_template
from pyecharts.charts import Bar
from pyecharts import options as opts
app = Flask(__name__)
def bar_base() -> Bar:
    c = (
        Bar()
        .add_xaxis(["Shirts", "Cardigans", "Chiffons", "Pants", "Heels", "Socks"])
        .add_yaxis("sales", [5, 20, 36, 10, 10, 20])
        .set_global_opts(title_opts=opts.TitleOpts(title="Flask & ECharts Bar Chart"))
    )
    return c
@app.route('/')
def index():
    # 1. Create the chart object
    my_chart = bar_base()
    # 2. Render the HTML template, passing the chart object
    #    The name 'my_chart' in render_template is the variable name in index.html
    return render_template('index.html', my_chart=my_chart)
if __name__ == '__main__':
    app.run(debug=True)
Explanation:
- We import
Barfrompyecharts.chartsandoptionsfor easy configuration. - We define a function
bar_base()that creates and returns a configuredBarchart object. - In the
index()route, we callbar_base()to get our chart. - We use
render_template('index.html', my_chart=my_chart)to pass the chart object to the template, naming itmy_chart.
Step 6: Run the Application
Save all your files and run the Flask app from your terminal:
python app.py
You will see output like this:
 * Serving Flask app 'app'
 * Debug mode: on
WARNING: This is a development server. Do not use it in a production deployment.
Use a production WSGI server instead.
 * Running on http://127.0.0.1:5000
Press CTRL+C to quit
Open your web browser and navigate to http://127.0.0.1:5000. You should see your bar chart!
Advanced: Passing Real Data from Flask
The true power comes when you pass dynamic data from your Python backend to the chart.
Let's modify the app to generate random data for the chart.
# app.py (updated version)
import random
from flask import Flask, render_template
from pyecharts.charts import Bar
from pyecharts import options as opts
app = Flask(__name__)
def generate_random_chart() -> Bar:
    # Generate random data
    categories = ["Product A", "Product B", "Product C", "Product D", "Product E"]
    values = [random.randint(10, 100) for _ in categories]
    c = (
        Bar()
        .add_xaxis(categories)
        .add_yaxis("Sales Volume", values)
        .set_global_opts(
            title_opts=opts.TitleOpts(title="Dynamic Sales Dashboard"),
            tooltip_opts=opts.TooltipOpts(trigger="axis"),
        )
    )
    return c
@app.route('/')
def index():
    my_chart = generate_random_chart()
    return render_template('index.html', my_chart=my_chart)
if __name__ == '__main__':
    app.run(debug=True)
Now, every time you refresh the page, the chart will show new random data. This is how you would connect your chart to a database, an API, or any other data source in your Python application.
Alternative: Using pyecharts-javascript (For more control)
For complex scenarios or if you want to separate your chart logic from your Flask app, you can use pyecharts-javascript. This library lets you write ECharts configuration in JSON format, which can be more easily managed.
Install:
pip install pyecharts-javascript
Modify app.py:
# app.py (using pyecharts-javascript)
from flask import Flask, render_template, jsonify
from pyecharts_javascript import JS
app = Flask(__name__)
@app.route('/')
def index():
    # Define the chart configuration as a Python dictionary
    chart_config = {
        "title": {"text": "Sales Data"},
        "tooltip": {},
        "xAxis": {"data": ["Shirts", "Cardigans", "Chiffons", "Pants", "Heels", "Socks"]},
        "yAxis": {},
        "series": [{
            "name": "sales",
            "type": "bar",
            "data": [5, 20, 36, 10, 10, 20]
        }]
    }
    # Pass the configuration as a JSON