Of course! Using a Python script for a Zabbix item is a powerful and flexible way to monitor custom metrics that Zabbix doesn't cover out-of-the-box. This is commonly done using Zabbix's zabbix_agent2 with the script item type.

Here’s a comprehensive guide covering everything from setup to best practices.
How It Works: The Core Concept
The process is straightforward:
- Zabbix Agent: The
zabbix_agent2on the target machine is configured to know about your Python script. - Zabbix Server/Proxy: The server requests data from the agent for a specific item.
- Zabbix Agent: The agent executes your Python script.
- Python Script: The script performs its task (e.g., queries an API, checks a log file, measures performance) and prints the result to standard output (stdout).
- Zabbix Agent: The agent captures the output from
stdoutand sends it back to the Zabbix Server. - Zabbix Server: The server receives the value and stores it.
The key is that your script must print the result to stdout. Anything printed to stderr (standard error) is typically considered a problem and will be logged by the agent, not captured as a metric.
Prerequisites
- A working Zabbix server/proxy and
zabbix_agent2on the target host. - Python installed on the target host.
- Necessary Python libraries for your script (e.g.,
requests,psutil,pymysql). These must be installed in the Python environment the agent will use.
Step-by-Step Implementation
Let's create a practical example: monitoring the number of active connections to a specific web server port.

Step 1: Create the Python Script
On your target host, create a directory for your custom scripts. A common location is /etc/zabbix/scripts/.
sudo mkdir -p /etc/zabbix/scripts
Now, create the Python script. Let's call it check_web_connections.py.
#!/usr/bin/env python3
import sys
import subprocess
import re
# --- Configuration ---
# The port to check for active connections
PORT = "8080"
# The output format expected by Zabbix: a single numeric value
# We'll use 'grep' to count lines, which is a simple way to get a number.
COMMAND = f"ss -tn | grep ':{PORT}$' | wc -l"
def main():
    """
    Executes a command to count active connections on a specific port
    and prints the result to stdout.
    """
    try:
        # Execute the command
        process = subprocess.Popen(COMMAND, shell=True, stdout=subprocess.PIPE, stderr=subprocess.PIPE, text=True)
        stdout, stderr = process.communicate()
        # Check for errors in the command execution
        if process.returncode != 0:
            print(f"Zabbix item error: Command failed with return code {process.returncode}. Error: {stderr.strip()}", file=sys.stderr)
            sys.exit(1) # Indicate failure to Zabbix
        # The result is in stdout, but it might have a newline. Strip it.
        connection_count = stdout.strip()
        # Basic validation to ensure it's a number
        if not connection_count.isdigit():
            print(f"Zabbix item error: Command did not return a valid number. Got: '{connection_count}'", file=sys.stderr)
            sys.exit(1)
        # Print the result to stdout. This is what Zabbix will capture.
        print(connection_count)
    except Exception as e:
        # Catch any other Python exceptions
        print(f"Zabbix item critical error: {str(e)}", file=sys.stderr)
        sys.exit(1)
if __name__ == "__main__":
    main()
Make the script executable:
sudo chmod +x /etc/zabbix/scripts/check_web_connections.py
Test the script manually:

sudo /etc/zabbix/scripts/check_web_connections.py
You should see a number (e.g., 5). If you see an error, it will appear on the console, which is good for debugging.
Step 2: Configure the Zabbix Agent
You need to tell the Zabbix agent about your script. Edit the agent configuration file, typically located at /etc/zabbix/zabbix_agent2.conf.
sudo nano /etc/zabbix/zabbix_agent2.conf
Add the following lines to the end of the file. This is the standard way to define a custom script item.
# UserParameter format:
# UserParameter=<key>,<shell_command>
# For a Python script, the shell command is just executing the script.
# Key: web.port8080.connections
# Command: Execute our Python script
UserParameter=web.port8080.connections,/etc/zabbix/scripts/check_web_connections.py
web.port8080.connections: This is the unique key you will use in Zabbix to reference this item. It's good practice to use a hierarchical naming scheme./etc/zabbix/scripts/check_web_connections.py: The full path to the executable script.
Save and close the file.
Step 3: Restart the Zabbix Agent
Apply the new configuration by restarting the agent service.
sudo systemctl restart zabbix-agent2
Step 4: Test the Item from the Zabbix Server
Before creating a full template, test if the agent can execute the script and return a value.
On your Zabbix Server (or Zabbix Proxy), use the zabbix_get command.
# Replace <target_host_ip_or_dns> with the IP address or hostname of your monitored host
zabbix_get -s <target_host_ip_or_dns> -p 10050 -k "web.port8080.connections"
-s: The target host.-p: The agent port (default is 10050).-k: The key you defined in the agent's config file.
If everything is set up correctly, zabbix_get will return the same number you saw when testing the script manually. If it fails, you'll get an error message. Common issues:
- Firewall blocking port 10050.
- Typo in the key or script path in the agent's config file.
- The script itself has an error (check agent logs:
journalctl -u zabbix-agent2).
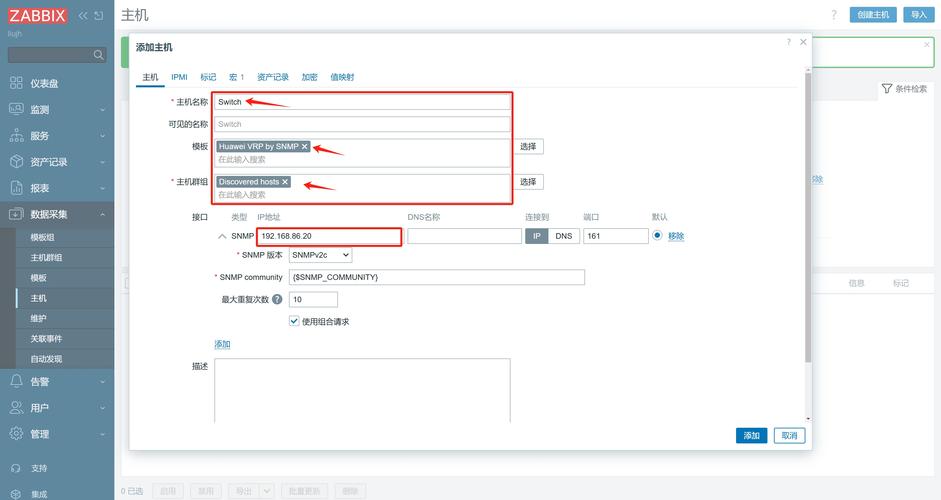
Step 5: Create a Zabbix Template and Link to Host
-
Go to your Zabbix GUI:
- Configuration -> Templates -> Create Template.
- Give it a name, e.g., "Python Custom Scripts".
- Add a group, e.g., "Templates".
- Save the template.
-
Create an Item in the Template:
- Open your new template and go to the Items tab.
- Click Create item.
- Name:
Web Port 8080 Active Connections - Key:
web.port8080.connections(This must match the key inUserParameterexactly). - Type:
Zabbix agent - Update interval: Set how often you want to check (e.g., 30s).
- Data type:
Numeric unsigned - Units:
connections(Optional, but good for clarity). - Click Add.
-
(Optional but Recommended) Create a Trigger:
- In the same template, go to the Triggers tab and click Create trigger.
- Name:
Too many connections on port 8080 - Expression:
{Python Custom Scripts:web.port8080.connections.last()} > 100(Adjust the value 100 as needed). - Severity:
WarningorHigh. - Click Add.
-
Link the Template to a Host:
- Go to Configuration -> Hosts.
- Select the host you want to monitor and click Link templates.
- Find your "Python Custom Scripts" template and add it.
- Click Update.
After a few minutes, you should see data coming in for your new item and the trigger will fire if the condition is met.
Advanced: Passing Arguments to the Script
Sometimes you want a single script that can be reused for different parameters (e.g., different ports). You can do this by using macros in the UserParameter.
Modified UserParameter
In /etc/zabbix/zabbix_agent2.conf:
# The {$PORT} is a user macro that will be replaced by Zabbix
UserParameter=web.port[*].connections,/etc/zabbix/scripts/check_web_connections.py $1
[*]creates an array parameter.$1refers to the first argument passed in the key.
Modified Python Script
The script needs to accept the port as a command-line argument.
#!/usr/bin/env python3
import sys
import subprocess
def main():
    if len(sys.argv) != 2:
        print("Zabbix item error: Usage: check_web_connections.py <port>", file=sys.stderr)
        sys.exit(1)
    port = sys.argv[1]
    COMMAND = f"ss -tn | grep ':{port}$' | wc -l"
    try:
        process = subprocess.Popen(COMMAND, shell=True, stdout=subprocess.PIPE, stderr=subprocess.PIPE, text=True)
        stdout, stderr = process.communicate()
        if process.returncode != 0:
            print(f"Zabbix item error: Command failed for port {port}. Error: {stderr.strip()}", file=sys.stderr)
            sys.exit(1)
        print(stdout.strip())
    except Exception as e:
        print(f"Zabbix item critical error for port {port}: {str(e)}", file=sys.stderr)
        sys.exit(1)
if __name__ == "__main__":
    main()
How to Use the New Parameterized Item
In Zabbix, when creating the item, the key is now different:
- Key:
web.port[8080].connections - Key:
web.port[443].connections
Zabbix will call /etc/zabbix/scripts/check_web_connections.py 8080 for the first item and /etc/zabbix/scripts/check_web_connections.py 443 for the second. This is much more flexible and maintainable.
Best Practices & Troubleshooting
- Error Handling: Always handle errors in your Python script and print them to
stderr. Usesys.exit(1)to signal failure to Zabbix, which can then trigger triggers. - Performance: Keep your scripts lightweight. A script that takes 30 seconds to run will make your Zabbix data collection lag.
- Dependencies: Ensure all required Python libraries are installed. If you use a virtual environment, you'll need to call the Python interpreter from that environment (e.g.,
/path/to/venv/bin/python /path/to/script.py). - Permissions: The
zabbixuser (or whatever user the agent runs as) must have execute permission on the script and read permission on any files it needs to access. - Agent Logs: If
zabbix_getfails or the item shows "Zabbix agent error", the first place to look is the agent log.- Systemd:
journalctl -u zabbix-agent2 -f - SysVinit:
tail -f /var/log/zabbix/zabbix_agent2.log
- Systemd:
- Debug Mode: You can run the agent in debug mode to see exactly what it's doing. This is very powerful for troubleshooting.
sudo zabbix_agent2 -d -c /etc/zabbix/zabbix_agent2.conf


