Of course! Using K-Means with the Canopy clustering algorithm as a pre-processing step is a classic and powerful technique, especially for large datasets. The Canopy algorithm is used to create initial, coarse clusters, which are then used to initialize K-Means. This approach is much more efficient than the standard K-Means++ initialization for very large datasets.

Here's a complete guide covering:
- What is Canopy Clustering? (The intuition)
- Why Use Canopy + K-Means? (The benefits)
- Implementation in Python: A step-by-step guide with code.
- Practical Example: Applying it to a sample dataset.
What is Canopy Clustering?
The Canopy algorithm is a fast, unsupervised, approximate clustering method. Unlike K-Means, it doesn't require you to specify the final number of clusters (K) upfront.
The Core Idea: Imagine you're trying to group people in a large hall by their height. Instead of measuring everyone against everyone else (which is slow), you set up two "gates":
- A loose gate (T1): If you can walk through this gate without ducking, you're in the "tall" canopy.
- A strict gate (T2): If you can walk through this gate without bending your knees, you're in the "very tall" canopy.
The algorithm works as follows:

- Set two distance thresholds:
T1(loose, e.g., 100) andT2(strict, e.g., 50).T1must be greater thanT2. - Pick a point at random from the dataset.
- Create a new Canopy: This point is the "center" of the new canopy.
- Assign all other points to this canopy if their distance to the center is less than T1.
- Remove all points from the dataset that are within T2 of the center. These points are now considered "covered" and won't be used as future canopy centers.
- Repeat steps 2-5 until all points are covered.
The result is a set of overlapping "canopies." Points that end up in the same canopy are likely to be in the same final K-Means cluster.
Why Use Canopy + K-Means?
This combination is primarily used for scalability and efficiency.
- Problem with Standard K-Means: The standard K-Means algorithm (especially with K-Means++ initialization) has a time complexity of roughly O(n), where n is the number of data points. For millions or billions of points, this can be very slow because every point must be considered for assignment in every iteration.
- The Canopy Solution:
- Fast Pre-processing: Canopy is very fast (O(n)) because it only requires a single pass over the data (with some random access). It quickly groups points into a smaller number of coarse clusters (the canopies).
- Smart Initialization: Instead of initializing K-Means centers randomly across the entire dataset, you can run Canopy first and then select the K final centers from the Canopy centers. This is a much better starting point than random initialization.
- Reduced Computation: You can even use the Canopies to limit the number of points K-Means needs to consider. For example, when assigning a point to a cluster, you only need to check the distance to the K-Means centers that were in the same Canopy as the point. This dramatically reduces the number of distance calculations.
Implementation in Python
There is no standard sklearn implementation for Canopy, so we will write our own. We will then use its output to initialize sklearn's KMeans.
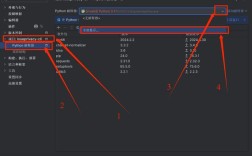
Step 1: Install Necessary Libraries
pip install numpy scikit-learn matplotlib
Step 2: Write the Canopy Clustering Algorithm
This function will take the data and the two distance thresholds T1 and T2 and return the list of final canopy centers.

import numpy as np
from sklearn.metrics.pairwise import euclidean_distances
def canopy(data, t1, t2):
    """
    Performs Canopy clustering.
    Args:
        data (np.array): The input data points (n_samples, n_features).
        t1 (float): The loose distance threshold.
        t2 (float): The strict distance threshold.
    Returns:
        list: A list of canopy centers (np.array).
    """
    if t1 <= t2:
        raise ValueError("T1 must be greater than T2.")
    canopies = []
    # Use a copy to avoid modifying the original data
    remaining_points = data.copy()
    while len(remaining_points) > 0:
        # 1. Pick a point at random
        center_idx = np.random.choice(len(remaining_points))
        center = remaining_points[center_idx]
        # 2. Add this center to our list of canopies
        canopies.append(center)
        # 3. Calculate distances from the chosen center to all remaining points
        # Using cdist is more efficient for large datasets than looping
        from scipy.spatial.distance import cdist
        distances = cdist([center], remaining_points, metric='euclidean')[0]
        # 4. Find points to be removed (within T2) and points in the canopy (within T1)
        remove_indices = np.where(distances < t2)[0]
        in_canopy_indices = np.where(distances < t1)[0]
        # 5. Remove points that are "covered" by this canopy
        # We must sort indices in descending order to remove correctly
        remove_indices_sorted = np.sort(remove_indices)[::-1]
        for idx in remove_indices_sorted:
            remaining_points = np.delete(remaining_points, idx, axis=0)
        # Optional: You can also log the points that just fall into the canopy
        # but are not removed, for analysis.
        # in_canopy_points = remaining_points[in_canopy_indices]
    return canopies
Step 3: Combine Canopy with K-Means
Now, we'll use the canopies to initialize K-Means. A simple strategy is to select the first K canopies as our initial centers.
from sklearn.cluster import KMeans
import matplotlib.pyplot as plt
def kmeans_with_canopy_init(data, k, t1, t2):
    """
    Performs K-Means clustering initialized by Canopy.
    Args:
        data (np.array): The input data points.
        k (int): The number of final clusters.
        t1 (float): The loose Canopy threshold.
        t2 (float): The strict Canopy threshold.
    Returns:
        KMeans: The fitted K-Means object.
        list: The initial centers chosen from Canopy.
    """
    print(f"Running Canopy clustering to find initial centers for K={k}...")
    # Step 1: Run Canopy to get a list of candidate centers
    canopy_centers = canopy(data, t1, t2)
    print(f"Found {len(canopy_centers)} Canopy centers.")
    # Step 2: Select K centers from the Canopy centers
    # A simple strategy is to take the first K.
    # A more advanced strategy could involve selecting the most "isolated" centers.
    if len(canopy_centers) < k:
        print(f"Warning: Canopy found only {len(canopy_centers)} centers, which is less than K={k}.")
        print("Falling back to K-Means++ initialization.")
        kmeans = KMeans(n_clusters=k, init='k-means++', n_init=10, random_state=42)
    else:
        initial_centers = np.array(canopy_centers[:k])
        print(f"Selected {k} initial centers from Canopy for K-Means.")
        # Step 3: Run K-Means with the custom initialization
        kmeans = KMeans(n_clusters=k, init=initial_centers, n_init=1, random_state=42)
    kmeans.fit(data)
    return kmeans, initial_centers
Practical Example
Let's see it in action on a synthetic dataset.
# Generate synthetic data
from sklearn.datasets import make_blobs
import time
# Create a dataset with 5 clear clusters
X, y_true = make_blobs(n_samples=5000,
                       centers=5,
                       cluster_std=1.0,
                       random_state=42)
# Plot the original data
plt.figure(figsize=(12, 5))
plt.subplot(1, 2, 1)
plt.scatter(X[:, 0], X[:, 1], s=5, c=y_true)"Original Data")
plt.xlabel("Feature 1")
plt.ylabel("Feature 2")
# --- Perform Canopy + K-Means ---
# These thresholds are crucial and should be tuned for your dataset.
# A good starting point is to analyze the distribution of pairwise distances.
T1 = 3.0