Of course! Let's break down the relationship between Anaconda, Python, and Bokeh. These are three distinct but related tools in the Python data science ecosystem.

Here’s a clear explanation of each one and how they work together.
Anaconda
- What it is: A distribution of Python and R. Think of it as a complete, pre-packaged toolkit for data science.
- What it includes:
- Python: The core programming language.
- Conda: A powerful package and environment manager. This is Anaconda's killer feature. It lets you create isolated "environments" where you can have different versions of Python and different sets of packages without them conflicting with each other.
- Hundreds of Pre-installed Packages: It comes with all the essential data science libraries you need out of the box, like NumPy, Pandas, Matplotlib, Jupyter, and many more.
- IDEs: It includes graphical tools like Anaconda Navigator (a point-and-click interface) and JupyterLab / Jupyter Notebook for interactive coding.
- Analogy: If Python is the engine of a car, Anaconda is the entire car dealership. It gives you the car (Python), the garage to work on it (Conda environments), the tools (packages), and the showroom (IDEs) all in one convenient package.
Why use Anaconda?
- Simplicity: Avoids the headache of manually installing dozens of packages and their dependencies.
- Environment Management: Crucial for managing different projects (e.g., one project needs Python 3.7 and an old version of a library, while another needs Python 3.11 and the latest versions).
- All-in-One Solution: Provides everything you need to start with data science in Python.
Python
- What it is: A high-level, general-purpose programming language. It's the foundation.
- What it's good for: Web development, automation, scripting, and, most importantly for this discussion, data science and scientific computing.
- Key Characteristics:
- Readable and Simple: Its syntax is clean and easy to learn.
- Vibrant Ecosystem: Its real power comes from its vast collection of third-party packages (libraries) that extend its functionality for specific tasks.
- Analogy: Python is the English language. It's a flexible and powerful way to communicate instructions. But on its own, it can't create a data visualization or perform complex statistical calculations. You need specialized tools (libraries) written in that language.
Bokeh
- What it is: A Python library for creating interactive, web-ready visualizations.
- What it does: It allows you to build beautiful and complex plots, charts, and dashboards that can be displayed in a web browser. It's designed to handle large datasets and create highly interactive graphics (zooming, panning, hovering, etc.).
- How it works: Bokeh generates its visualizations in JavaScript. You write the code in Python, and Bokeh translates it into JavaScript that runs in the user's browser. This means you don't need to know JavaScript to create powerful web-based graphics.
- Analogy: If Python is the English language, Bokeh is a specialized vocabulary for creating beautiful, interactive charts and maps. It's a specific tool you use within the Python language to achieve a particular goal (data visualization).
How They All Work Together: The Workflow
This is where the magic happens. Here is a typical workflow using all three:
-
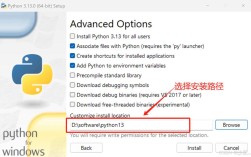
Install Anaconda: You download and install Anaconda on your computer. This gives you a base Python installation and the
condapackage manager. (图片来源网络,侵删)
 -
Create a Project Environment: You open your terminal or Anaconda Navigator and create a new, isolated environment for your project. This is a best practice.
# Create a new environment called 'data-viz' with Python 3.10
conda create -n data-viz python=3.10
# Activate the environment
conda activate data-viz
-
Install Bokeh: Inside your active environment, you use
conda(orpip) to install the Bokeh library.# Install Bokeh using conda conda install bokeh # Or you can use pip # pip install bokeh
-
Write Python Code with Bokeh: You open a Jupyter Notebook (which came with Anaconda) or a Python script and start writing code. You import Bokeh and use its functions to create a plot.
Example: A Simple Bokeh Plot
 (图片来源网络,侵删)
# This is a Python script
from bokeh.plotting import figure, show
from bokeh.io import output_notebook
# Tell Bokeh to display plots in the Jupyter Notebook
output_notebook()
# Create some data
x = [1, 2, 3, 4, 5]
y = [6, 7, 2, 4, 5]
# Create a plot with Bokeh's tools
p = figure(title="Simple Line Example", tools="pan,box_zoom,reset,save")
# Add a line renderer
p.line(x, y, legend_label="Temp.", line_width=2)
# Show the plot
show(p)
When you run this code in your Jupyter Notebook, Bokeh will generate an interactive plot that you can manipulate right in your browser.
Summary Table
| Tool | Type | Role | Analogy |
|---|---|---|---|
| Anaconda | Distribution / Platform | Provides a complete, managed Python environment with essential tools. | The Data Science Toolkit or the Garage. |
| Python | Programming Language | The foundational language you use to write code and logic. | The Language (English). |
| Bokeh | Library / Package | A specific tool for creating interactive web-based visualizations. | A specialized Vocabulary for creating charts. |
In short: You use Anaconda to manage your Python environment, and within that Python environment, you use the Bokeh library to create interactive visualizations.