Of course. "Java heap space" is one of the most common and critical errors Java developers encounter. Let's break it down from what it is to how to fix it.
What is the Java Heap Space?
Think of the Java Heap as the main memory area where your Java application stores objects and arrays created by your running code.
- It's a shared memory pool: All threads in an application share the same heap.
- It's managed by the JVM: The Java Virtual Machine automatically allocates memory on the heap when you use the
newkeyword. - It's garbage collected: The JVM has a process called Garbage Collection (GC) that automatically identifies objects that are no longer being used and reclaims their memory to make space for new objects.
The "Java heap space" error occurs when the application tries to add a new object to the heap, but there isn't enough free, contiguous memory left to accommodate it, even after the garbage collector has run.
Analogy: Imagine your heap is a bookshelf. You add and remove books (objects) all day. The Garbage Collector is like a librarian who comes along and takes away books you no longer read. If you try to put a very large, new encyclopedia on the shelf, but the only space left is a bunch of small, scattered gaps, you can't fit it. The "Java heap space" error is like the librarian telling you, "Sorry, there's no single big enough spot for your new book."
The Error Message
You will typically see an error message that looks like this:
java.lang.OutOfMemoryError: Java heap spaceThis is a subtype of java.lang.OutOfMemoryError. The key part is Java heap space, which tells you exactly which memory pool is exhausted.
Common Causes of the Error
Here are the most frequent reasons why your heap runs out of space:
| Cause | Description | Example |
|---|---|---|
| Memory Leak | The most common cause. Your application is holding onto references to objects that are no longer needed, preventing the Garbage Collector from reclaiming their memory. Over time, these leaked objects fill up the heap. | A cache that grows indefinitely without a proper eviction policy. A static Map that is constantly populated but never cleared. |
| Inadequate Heap Size | The heap size allocated to the JVM at startup is simply too small for the amount of data your application needs to process during its normal operation. | You allocated only 128MB of heap (-Xmx128m) but your application needs to process a 500MB file in memory at once. |
| Processing Large Data Sets | You are trying to load an entire large dataset (e.g., a huge file, a massive database result set) into memory all at once, instead of processing it in smaller chunks. | Reading a multi-gigabyte CSV file into a single List<String[]> in memory. |
| Inefficient Data Structures | Using data structures that consume more memory than necessary for the data they hold. | Storing millions of primitive int values in a wrapper ArrayList<Integer>, which can use 2-4x more memory. |
| Infinite Loops | A bug in your code causes an infinite loop that continuously creates new objects without ever releasing them. | A loop that should terminate but doesn't, adding items to a list inside the loop on every iteration. |
How to Fix It: A Step-by-Step Guide
Follow these steps, starting with the easiest and most common solutions.
Step 1: Increase the Heap Size (The Quick Fix)
If you just need more space for a legitimate, large workload, you can increase the maximum heap size using JVM flags.

-Xmx: Sets the maximum heap size.-Xms: Sets the initial heap size (it's good practice to set this equal to-Xmxto avoid heap resizing pauses).
How to apply it:
-
For running applications (e.g., Tomcat, Spring Boot JAR):
# For a JAR file
java -Xms512m -Xmx2g -jar my-application.jar
# For a Tomcat server (in CATALINA_OPTS or setenv.sh)
export CATALINA_OPTS="-Xms512m -Xmx2g"
Caution: This is often just a band-aid. If you have a memory leak, increasing the heap size will only delay the error. The application will eventually still crash.
Step 2: Fix the Memory Leak (The Proper Fix)
If increasing the heap size doesn't work or you're running on a limited-memory server, you have a memory leak. You need to find and fix it.
Use a Profiler to Find the Leak: A profiler is an essential tool for this. It can analyze your running application's memory usage over time.
-
VisualVM: Bundled with the JDK. Simple and powerful.
- Run your app with the
-Xmxflag set. - Launch
jvisualvmfrom your JDK'sbindirectory. - Connect to your running application.
- Go to the "Monitor" tab to see the heap usage graph over time. If you see a steady, unreleased climb, you have a leak.
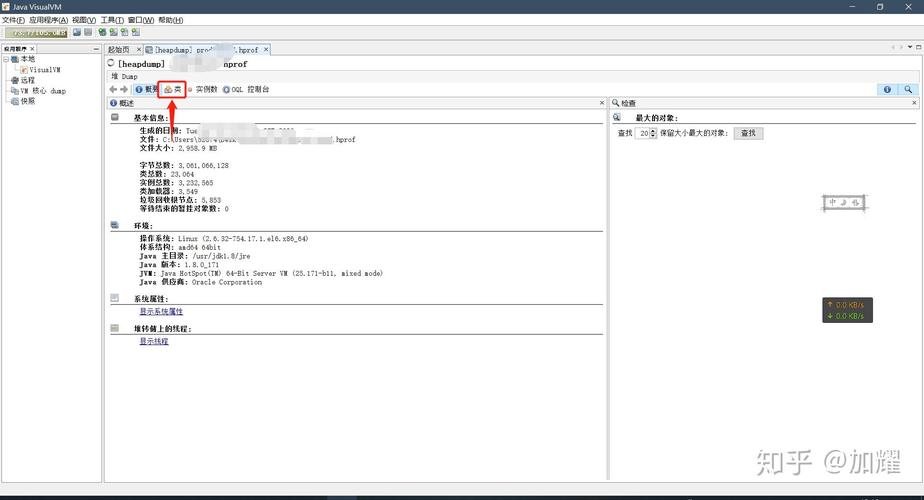
- Go to the "Sampler" tab and take a Heap Dump.
- In the heap dump analyzer, look for classes with a high number of instances or a large "retained heap" size. This will point you directly to the objects that are not being garbage collected.
- Run your app with the
-
Eclipse MAT (Memory Analyzer Tool): The gold standard for analyzing heap dumps.
- Take a heap dump (from VisualVM, JConsole, or with the command-line tool
jmap). - Open the
.hproffile in Eclipse MAT. - Use the "Leak Suspects" report. It's incredibly good at automatically finding potential memory leaks and explaining the chain of object references that is keeping the data in memory.
- Take a heap dump (from VisualVM, JConsole, or with the command-line tool
-
YourKit / JProfiler: Commercial profilers with more advanced features and better performance for large applications.
Common Leak Patterns to Look For:
- Static Collections: A
static MaporListthat is added to but never cleared.-
public class Cache {
private static final Map<String, BigObject> cache = new HashMap<>(); // DANGER!
public void addToCache(String key, BigObject obj) {
    cache.put(key, obj);
}
}
-
- Unclosed Resources: Database connections, file streams, or network sockets that are not properly closed in a
finallyblock or with try-with-resources. - Listeners/Callbacks: Registering event listeners or callbacks but never unregistering them.
Step 3: Optimize Data Processing
If you don't have a leak but are just processing too much data at once, change your approach.
-
Process in Chunks: Instead of loading a 10GB file into memory, read it line by line or in small batches (e.g., 1000 lines at a time).
// Bad: Loads entire file into memory List<String> allLines = Files.readAllLines(Paths.get("huge-file.txt")); // Good: Processes line by line with minimal memory try (Stream<String> lines = Files.lines(Paths.get("huge-file.txt"))) { lines.forEach(line -> { // process each line }); } -
Use More Efficient Data Structures: If you are storing many primitives, consider using primitive collections libraries (like Eclipse Collections or fastutil) or arrays instead of their wrapper counterparts (e.g.,
int[]instead ofList<Integer>).
Summary: Action Plan
- First, try increasing the heap size (
-Xmx). If the problem goes away, you might just need more memory for your workload. - If the error persists or you suspect a leak, get a heap dump. Use VisualVM or another profiler while the application is running and the heap is growing.
- Analyze the heap dump with Eclipse MAT. Look for "Leak Suspects" and objects with high retained heap.
- Identify the code responsible for holding onto the leaked objects and fix the reference (e.g., clear a static map, close a resource, remove a listener).
- Refactor your code to process large datasets in smaller, manageable chunks instead of all at once.


