Of course! memory_profiler is an essential tool for any Python developer who needs to understand and optimize their application's memory usage. It helps you answer questions like:
- Which functions are using the most memory?
- How much memory is allocated at each line of my code?
- Is there a memory leak in my script?
Here’s a comprehensive guide on how to use it, from installation to interpretation and advanced use cases.
Installation
First, you need to install the package. It's available on PyPI.
pip install memory_profiler
Basic Usage: Line-by-Line Profiling
This is the most common and powerful feature of memory_profiler. It gives you a line-by-line breakdown of memory consumption.
Step 1: Decorate Your Function
To profile a function, you decorate it with @profile. Crucially, you do not need to import profile in your script. The memory_profiler script will handle this for you.
Step 2: Run the Script with the Profiler
You don't run your script with python my_script.py. Instead, you use the -m flag to run it as a module.
python -m memory_profiler my_script.py
Let's see it in action.
Example: A Function with High Memory Usage
Create a file named my_script.py:
# my_script.py
# Note: We do NOT import 'profile' here.
# The decorator is added by the memory_profiler module.
@profile
def create_large_list(size):
    """Creates a large list and returns it."""
    print(f"Creating a list of {size} elements...")
    data = [i for i in range(size)]
    return data
@profile
def process_data(data):
    """Processes the data by creating a new list."""
    print("Processing data...")
    processed = [x * 2 for x in data]
    return processed
if __name__ == "__main__":
    # This block will only run when the script is executed directly
    large_list = create_large_list(1_000_000)
    processed_list = process_data(large_list)
    # Keep a reference to the processed list to prevent it from being
    # garbage collected before the profiler finishes.
    del large_list
    print(f"Finished processing. Length of result: {len(processed_list)}")
Step 3: Run and Interpret the Output
Now, execute the script from your terminal:
python -m memory_profiler my_script.py
You will get a detailed output like this:
Creating a list of 1000000 elements...
Filename: my_script.py
Line #    Mem usage    Increment  Occurrences   Line Contents
=============================================================
     3     38.8 MiB     38.8 MiB           1   @profile
     4                                         def create_large_list(size):
     5                                             """Creates a large list and returns it."""
     6     38.8 MiB      0.0 MiB           1       print(f"Creating a list of {size} elements...")
     7    116.4 MiB     77.6 MiB           1       data = [i for i in range(size)]
     8   116.4 MiB      0.0 MiB           1       return data
     9
    10
    11     38.8 MiB     38.8 MiB           1   @profile
    12                                         def process_data(data):
    13                                             """Processes the data by creating a new list."""
    14     38.8 MiB      0.0 MiB           1       print("Processing data...")
    15   194.0 MiB     77.6 MiB           1       processed = [x * 2 for x in data]
    16   194.0 MiB      0.0 MiB           1       return processed
    17
    18
    19    194.0 MiB    194.0 MiB           1   if __name__ == "__main__":
    20    194.0 MiB      0.0 MiB           1       large_list = create_large_list(1_000_000)
    21    194.0 MiB      0.0 MiB           1       processed_list = process_data(large_list)
    22    194.0 MiB      0.0 MiB           1       del large_list
    23    194.0 MiB      0.0 MiB           1       print(f"Finished processing. Length of result: {len(processed_list)}")
Creating a list of 1000000 elements...
Processing data...
Finished processing. Length of result: 1000000
Understanding the Output Table:
- Line #: The line number in your source file.
- Mem usage: The total memory consumed by the Python process up to that line.
- Increment: The change in memory since the last line. This is the most important column. It tells you exactly how much memory a specific line or block of code allocated.
- Occurrences: How many times that line was executed.
- Line Contents: The actual code from your file.
Analysis of the Example:
- Line 7 (
data = [...]): TheIncrementis+77.6 MiB. This clearly shows that the list comprehension on this line allocated ~77.6 megabytes of memory. - Line 15 (
processed = [...]): TheIncrementis again+77.6 MiB. This shows that creating the second list consumed another 77.6 MiB. - Line 20 (
large_list = ...): TheMem usagejumps from8 MiBto0 MiB. This is because thecreate_large_listfunction returns thedatalist, andlarge_listnow holds a reference to it in the main script's scope. - Line 21 (
processed_list = ...): TheMem usagestays at0 MiB. This is becauseprocess_datareturns theprocessedlist, which is assigned toprocessed_list. Sincelarge_listis still in scope, we have both large lists in memory at the same time (6 MiB * 2 = 155.2 MiB), plus the base memory usage. - Line 22 (
del large_list): This is a key moment. When we delete the reference tolarge_list, Python's garbage collector can free that memory. If you look closely, theMem usagewill drop slightly after this line, though the exact amount can vary based on the garbage collection timing.
Advanced Usage: Memory Profiling for Imported Functions
What if you want to profile a function inside a module that you import into your main script? You can't decorate the source code of an installed library.
The solution is to use the profile decorator programmatically.
Step 1: Create a module to be imported
Create a file named my_module.py:
# my_module.py
def memory_hungry_function(n):
    """A function that creates a large dictionary."""
    print(f"Module: Creating a dictionary with {n} items...")
    data = {i: f"value_{i}" for i in range(n)}
    return data
Step 2: Create the main script and apply the decorator
Create main_script.py:
# main_script.py
from memory_profiler import profile
import my_module
# Decorate the imported function at runtime
my_module.memory_hungry_function = profile(my_module.memory_hungry_function)
if __name__ == "__main__":
    print("Calling the decorated function from the imported module...")
    my_module.memory_hungry_function(500_000)
    print("Done.")
Step 3: Run the script
python main_script.py
The output will show the memory profile for memory_hungry_function as if it were decorated in its source file.
Comparing Memory Usage: memory_usage
Sometimes you just want to measure the peak memory usage of a block of code, not line-by-line. For this, you can use the memory_usage function.
from memory_profiler import memory_usage
import time
def my_function():
    # Simulate some work
    data = [i**2 for i in range(1_000_000)]
    time.sleep(1) # Keep the data in memory for a while
    return data
# Measure the memory usage of a specific function
mem_usage = memory_usage((my_function, (), {}), interval=0.1)
print(f"Peak memory usage: {max(mem_usage)} MiB")
print(f"Memory usage profile: {mem_usage}")
Arguments for memory_usage:
(my_function, (), {}): A tuple containing:- The function to execute.
- A tuple of positional arguments (empty here).
- A dictionary of keyword arguments (empty here).
interval=0.1: The time interval in seconds at which to sample memory usage. Smaller values give more detail but have more overhead.
Profiling Memory Usage in Jupyter Notebooks
memory_profiler integrates seamlessly with Jupyter notebooks.
-
Install the IPython extension:
pip install ipython
pip install memory_profiler
-
Load the extension in a notebook cell:
%load_ext memory_profiler
-
Use the
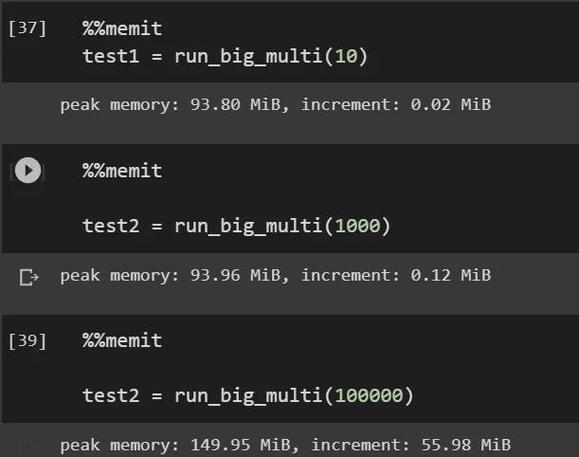
%memitmagic command for quick, one-off measurements:def create_list(n): return [i for i in range(n)] %memit create_list(1_000_000)Output:
peak memory: 78.38 MiB, increment: 39.38 MiB -
Use the
%%mprunmagic command for detailed line-by-line profiling (this is the equivalent of the command-line tool):%%mprun -f my_function my_function()
Note:
%%mpruncan only profile functions defined in the same notebook cell.
Tips for Effective Memory Profiling
- Run in a Clean Environment: Other running processes can affect memory readings. For best results, run your profiling script in a dedicated terminal or environment.
- Beware of Garbage Collection: The Python garbage collector can run at unpredictable times, which can cause memory to be freed at lines you didn't expect. The
delkeyword is your friend to explicitly remove references and see memory being freed. - Combine with Other Tools:
memory_profilertells you where memory is being allocated. To understand what kind of objects are filling up memory, use a tool liketracemalloc(built into Python) to get stack traces of allocations. - Profile Realistic Workloads: Profile your entire application or a realistic chunk of it, not just a small, isolated function. The overhead of the profiler itself can sometimes affect results.
Summary: memory_profiler vs. tracemalloc
| Feature | memory_profiler |
tracemalloc (Built-in) |
|---|---|---|
| Primary Use | Line-by-line memory allocation analysis. | Tracking memory allocations and comparing snapshots. |
| How it Works | Decorator or command-line tool that samples memory at each line. | Traces every memory block allocation, storing the stack trace. |
| Output | A table showing memory usage per line of code. | A list of memory blocks with their locations in the code. |
| Best For | Finding which specific line or function in your code is using the most memory. | Finding memory leaks, comparing memory usage between two points in time, and understanding the source of allocations. |
| Usage | python -m memory_profiler script.py or @profile |
python -m tracemalloc and tracemalloc.take_snapshot() |
For most day-to-day debugging of memory usage in your own code, memory_profiler is the perfect starting point.

