Of course! "Python error visual" is a great way to think about debugging. It's not just about reading the text; it's about understanding the structure and flow of the error to find the problem quickly.

Let's break down how to "visualize" a Python error using a real-world example.
The Anatomy of a Traceback (The Visual Map)
When your code crashes, Python doesn't just say "Error". It gives you a traceback. This is a visual map of the disaster. It shows you:
- The Crash Site: The exact file, line number, and code that caused the error.
- The Call Stack: The sequence of function calls that led to the crash, from the bottom up.
- The Error Type & Message: A short description of what went wrong (e.g.,
TypeError,NameError).
Let's create a script that will intentionally fail and then dissect its traceback.
Example Code with an Error
Imagine you have a file named visual_error.py with the following code:

# visual_error.py
def process_data(data_list):
    """Processes a list of data by finding the average."""
    print("-> process_data() started")
    total = sum(data_list)
    average = total / len(data_list)
    print(f"-> Average calculated: {average}")
    return average
def load_and_process_data():
    """Loads data from a 'database' and processes it."""
    print("-> load_and_process_data() started")
    # Our 'database' is just a hard-coded list for this example
    raw_data = [10, 20, 30, 40, "fifty"] # <-- This is the problem!
    # We try to process it
    processed_value = process_data(raw_data)
    print(f"-> Final processed value: {processed_value}")
    return processed_value
# This is the main entry point of our script
if __name__ == "__main__":
    print("Starting the data processing pipeline...")
    try:
        final_result = load_and_process_data()
        print(f"Pipeline finished successfully. Result: {final_result}")
    except Exception as e:
        print(f"\n--- AN ERROR OCCURRED ---")
        # The traceback will be printed automatically here
        raise # Re-raise the exception so we can see the full traceback
Running the Code and Getting the Error
When you run this script from your terminal:
$ python visual_error.py
You get the following traceback output:
Starting the data processing pipeline...
-> load_and_process_data() started
-> process_data() started
--- AN ERROR OCCURRED ---
Traceback (most recent call last):
  File "visual_error.py", line 25, in <module>
    final_result = load_and_process_data()
  File "visual_error.py", line 17, in load_and_process_data
    processed_value = process_data(raw_data)
  File "visual_error.py", line 7, in process_data
    average = total / len(data_list)
TypeError: unsupported operand type(s) for /: 'int' and 'str'
Visual Breakdown of the Error
Let's visualize this traceback piece by piece.
The Error Type and Message (The "What")
TypeError: unsupported operand type(s) for /: 'int' and 'str'TypeError: This is the error type. It tells you the problem is related to types. You're trying to perform an operation on an object of the wrong type.unsupported operand type(s) for /: 'int' and 'str': This is the message. It's a direct translation: "You can't use the division operator () on an integer (int) and a string (str)."
Visualization: Think of this as the Headline of the disaster report. It tells you the nature of the problem.
(图片来源网络,侵删)

The Call Stack (The "How We Got Here")
The traceback shows the stack of function calls, from the most recent (the top) back to the original call (the bottom).
  File "visual_error.py", line 7, in process_data
    average = total / len(data_list)
  File "visual_error.py", line 17, in load_and_process_data
    processed_value = process_data(raw_data)
  File "visual_error.py", line 25, in <module>
    final_result = load_and_process_data()
This is the most important part for visualization. Let's draw it:
+-----------------------------------------------------+
|  Top of the Stack (The Crash Site)                  |
|                                                     |
|  File "visual_error.py", line 7, in process_data    |
|    average = total / len(data_list)                 |
|                                                     |
|  ^                                                   |
|  |                                                   |
|  | Called from here...                               |
|  |                                                   |
|  V                                                   |
|  File "visual_error.py", line 17, in load_and_process|
|    processed_value = process_data(raw_data)         |
|                                                     |
|  ^                                                   |
|  |                                                   |
|  | Called from here...                               |
|  |                                                   |
|  V                                                   |
|  Bottom of the Stack (The Entry Point)              |
|  File "visual_error.py", line 25, in <module>       |
|    final_result = load_and_process_data()           |
|                                                     |
+-----------------------------------------------------+
File "visual_error.py", line 7, in process_data: This is the line where the error actually happened. Python was executing theprocess_datafunction and got stuck on line 7.File "visual_error.py", line 17, in load_and_process_data: This shows thatprocess_datawas called from insideload_and_process_dataon line 17.File "visual_error.py", line 25, in <module>: This shows thatload_and_process_datawas called from the main part of the script (the "global scope" or<module>).
Visualization: This is the breadcrumb trail or the map of the execution path. You follow it from the top down to understand the context of the crash.
Putting It All Together: The Diagnosis
Now, let's use this visual information to fix the bug.
-
Start at the top of the traceback.
- The error is
TypeError: unsupported operand type(s) for /: 'int' and 'str'. - The crash is at
visual_error.py, line 7, inside theprocess_datafunction. - The specific line is:
average = total / len(data_list).
- The error is
-
Analyze the crashing line.
- The operator needs two numbers. We have
totalon the left andlen(data_list)on the right. - The error says one is an
intand the other is astr. len()always returns an integer. So,len(data_list)must be theint.- This means
totalmust be thestr. How cansum(data_list)result in a string? It can't, unlessdata_listcontains a string.
- The operator needs two numbers. We have
-
Trace back up the call stack to find the source of the bad data.
- The
process_datafunction was called fromload_and_process_dataon line 17. - Let's look at that line:
processed_value = process_data(raw_data). - The data being passed is
raw_data. This variable was defined insideload_and_process_data.
- The
-
Find the bug in the source function.
- Look at the definition of
raw_datainsideload_and_process_data:raw_data = [10, 20, 30, 40, "fifty"] # <-- Aha!
- The list contains a string,
"fifty". Whensum()tries to add this to the integers, it fails. But Python is smart enough to not add a number and a string directly. Instead, it fails inside thelen()call becauselen()is trying to figure out how many items are in a list that contains a string that can't be summed.
- Look at the definition of
The Fix
The solution is to ensure all items in raw_data are numbers. We can do this by cleaning the data before passing it.
# In load_and_process_data()
raw_data = [10, 20, 30, 40, "fifty"]
# FIX: Convert all items to integers before processing
clean_data = []
for item in raw_data:
    try:
        clean_data.append(int(item))
    except ValueError:
        print(f"Warning: Could not convert '{item}' to an integer. Skipping.")
# Now pass the clean data
processed_value = process_data(clean_data)
Tools for Better Visualization
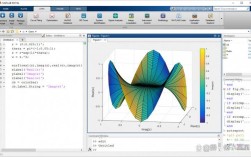
For an even more powerful visual debugging experience, use an IDE like Visual Studio Code or PyCharm.
- IDE Integration: When an error occurs, the IDE will automatically highlight the exact line of code in red.
- Interactive Debuggers: You can use a debugger to pause your code at any point and inspect the values of all variables. This lets you "see" the state of your program at the moment of failure, which is the ultimate visualization.
| Method | Pros | Cons |
|---|---|---|
| Print Statements | Simple, works everywhere. | Clutters code, can be slow. |
| Traceback Analysis | The standard, powerful way to find errors. | Requires reading text. |
| IDE Highlighting | Instant visual cue of the error location. | Requires a modern IDE. |
| Interactive Debugger | The most powerful. Lets you step through code and inspect variables. | Steeper learning curve. |
By learning to "visualize" the traceback, you move from randomly guessing where the bug is to systematically following a map directly to the source of the problem.