Of course! The phrase "python dataframe for" is a very common search query. People usually mean:

- "How do I create a Python DataFrame?" (The most common)
- "What is a Python DataFrame and what is it for?"
- "How do I perform a specific task on a DataFrame?"
I'll cover all three, starting with the most popular answer.
What is a DataFrame and What is it For?
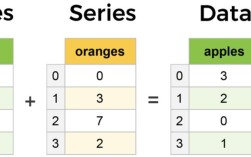
A DataFrame is the primary data structure in the Pandas library for Python. Think of it as a powerful, in-memory version of a spreadsheet or a SQL table.
Key Characteristics:
- 2-dimensional table: Data is organized into rows and columns.
- Labeled axes: Both rows and columns can have labels (an index for rows, column names for columns).
- Heterogeneous data: It can hold data of different types (integers, floats, strings, etc.) in different columns.
- Rich functionality: It comes with hundreds of built-in methods for data manipulation, cleaning, analysis, and visualization.
What is it for? DataFrames are the foundation for data analysis in Python. You use them to:

- Clean messy data: Handle missing values, filter out incorrect data, and fix data types.
- Transform data: Add new columns, combine datasets, reshape data (e.g., from wide to long format).
- Analyze data: Calculate summary statistics (mean, median, sum), group data by categories, and perform complex aggregations.
- Visualize data: Easily create charts and graphs from your data.
- Export/Import data: Read data from and write data to CSV files, Excel spreadsheets, SQL databases, and more.
How to Create a Python DataFrame
First, you need to install and import the Pandas library.
pip install pandas
Then, in your Python script or notebook:
import pandas as pd
import numpy as np # Often used for creating sample data
Here are the most common ways to create a DataFrame.
a) From a Dictionary of Lists
This is the most common and intuitive method. Each key in the dictionary becomes a column name, and the corresponding list becomes the column's data.

data = {
    'Name': ['Alice', 'Bob', 'Charlie', 'David'],
    'Age': [25, 30, 35, 28],
    'City': ['New York', 'Los Angeles', 'Chicago', 'Houston']
}
# Create the DataFrame
df = pd.DataFrame(data)
print(df)
Output:
      Name  Age         City
0    Alice   25     New York
1      Bob   30  Los Angeles
2  Charlie   35      Chicago
3    David   28      Houston
b) From a List of Dictionaries
Each dictionary in the list represents a row. This is very useful when you get data from an API.
data_list = [
    {'Name': 'Alice', 'Age': 25, 'City': 'New York'},
    {'Name': 'Bob', 'Age': 30, 'City': 'Los Angeles'},
    {'Name': 'Charlie', 'Age': 35, 'City': 'Chicago'}
]
df_list = pd.DataFrame(data_list)
print(df_list)
Output:
      Name  Age         City
0    Alice   25     New York
1      Bob   30  Los Angeles
2  Charlie   35      Chicago
c) From a List of Lists (or NumPy Array)
You need to provide the column names separately.
# Data as a list of lists
data = [
    ['Alice', 25, 'New York'],
    ['Bob', 30, 'Los Angeles'],
    ['Charlie', 35, 'Chicago']
]
# Column names
columns = ['Name', 'Age', 'City']
df_list_of_lists = pd.DataFrame(data, columns=columns)
print(df_list_of_lists)
Output:
      Name  Age         City
0    Alice   25     New York
1      Bob   30  Los Angeles
2  Charlie   35      Chicago
d) From a CSV or Excel File (Most Real-World Scenario)
This is what you'll do 99% of the time. Pandas makes reading files incredibly easy.
# Assuming you have a file named 'data.csv'
# Name,Age,City
# Eve,22,Boston
# Frank,40,Seattle
# Read from a CSV file
# df_from_csv = pd.read_csv('data.csv')
# For this example, let's create the file first
with open('data.csv', 'w') as f:
    f.write("Name,Age,City\n")
    f.write("Eve,22,Boston\n")
    f.write("Frank,40,Seattle\n")
# Now read it
df_from_csv = pd.read_csv('data.csv')
print(df_from_csv)
Output:
   Name  Age     City
0    Eve   22   Boston
1  Frank   40  Seattle
Common DataFrame Operations (The "For" part)
Once you have a DataFrame, here are the essential operations you'll perform.
Let's use our first DataFrame for these examples:
import pandas as pd
data = {'Name': ['Alice', 'Bob', 'Charlie', 'David'],
        'Age': [25, 30, 35, 28],
        'City': ['New York', 'Los Angeles', 'Chicago', 'Houston']}
df = pd.DataFrame(data)
Viewing Data
# View the first 5 rows
print(df.head())
# Get a summary of the DataFrame (info about columns, data types, non-null counts)
print(df.info())
# Get descriptive statistics for numeric columns
print(df.describe())
Selecting Data
# Select a single column (returns a Pandas Series)
ages = df['Age']
print(ages)
# Select multiple columns (returns a new DataFrame)
subset = df[['Name', 'City']]
print(subset)
# Select rows by index label
# print(df.loc[0]) # Selects the first row
# Select rows by integer position
# print(df.iloc[0]) # Selects the first row
Filtering Data (Conditional Selection)
This is one of the most powerful features.
# Find people older than 30
older_than_30 = df[df['Age'] > 30]
print(older_than_30)
# Find people in New York AND older than 25
ny_and_over_25 = df[(df['City'] == 'New York') & (df['Age'] > 25)]
print(ny_and_over_25)
Adding/Modifying Data
# Add a new column
df['Country'] = 'USA'
# Modify an existing column
df['Age'] = df['Age'] + 1 # Everyone gets a year older!
print(df)
Handling Missing Data
# Create a DataFrame with missing values
df_with_nan = df.copy()
df_with_nan.loc[1, 'Age'] = np.nan # Set Bob's age to NaN
# Check for missing values
print(df_with_nan.isnull().sum())
# Drop rows with any missing values
# df_dropped = df_with_nan.dropna()
# Fill missing values with a specific number (e.g., the mean age)
mean_age = df_with_nan['Age'].mean()
df_filled = df_with_nan.fillna({'Age': mean_age})
print("\nFilled DataFrame:")
print(df_filled)
Grouping and Aggregating Data
This is for answering questions like "What is the average age in each city?"
# Create a DataFrame with multiple people in the same city
data_group = {'City': ['New York', 'Los Angeles', 'New York', 'Chicago', 'Los Angeles'],
              'Sales': [500, 600, 450, 800, 750]}
df_group = pd.DataFrame(data_group)
# Group by 'City' and calculate the mean sales for each city
sales_by_city = df_group.groupby('City')['Sales'].mean()
print(sales_by_city)
Output:
City
Chicago          800
Los Angeles      675
New York         475
Name: Sales, dtype: int64
Saving a DataFrame
# Save to a new CSV file (without the index)
df.to_csv('updated_data.csv', index=False)
# Save to an Excel file
# df.to_excel('updated_data.xlsx', index=False, sheet_name='Sheet1')
Summary
| Task | Code Example |
|---|---|
| Import | import pandas as pd |
| Create from Dict | df = pd.DataFrame(my_dict) |
| Read from CSV | df = pd.read_csv('file.csv') |
| View Head | df.head() |
| Select Column | df['column_name'] |
| Filter Rows | df[df['Age'] > 30] |
| Add Column | df['new_col'] = 'value' |
| Group and Aggregate | df.groupby('category')['value'].mean() |
| Save to CSV | df.to_csv('new_file.csv', index=False) |