Of course! "Throughput" is a critical performance metric in software development, especially for systems that process data. Let's break down what it means, how to measure it in Python, and the factors that affect it.

What is Throughput?
Throughput is a measure of the amount of work completed in a given period of time. It's typically expressed as:
- Items per second (e.g., 1000 requests/sec, 5000 records/sec)
- Megabytes per second (e.g., 50 MB/sec)
- Transactions per second (TPS)
In simple terms, throughput answers the question: "How much can my system handle?"
It's important to distinguish it from Latency:
- Latency: The time it takes to complete a single task (e.g., "How long does it take to process one request?"). This is a measure of speed.
- Throughput: The number of tasks completed in a unit of time. This is a measure of capacity.
You can have low latency (fast individual tasks) but low throughput if you can only do one task at a time. Conversely, you can have high throughput by processing many tasks in parallel, even if each one has higher latency.

How to Measure Throughput in Python
Measuring throughput involves running a process for a fixed amount of time and counting how many units of work are completed.
The Core Formula
The fundamental formula is straightforward:
Throughput = Total Units of Work / Total Time TakenLet's look at a simple, manual example and then use a popular library for more robust testing.
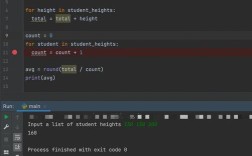
Example 1: Manual Measurement (Processing a List)
Imagine you have a function that processes a single item and you want to know how many items you can process per second.
import time
# A sample processing function. Let's pretend it does some work.
def process_item(item):
    # Simulate a small amount of work
    time.sleep(0.01) # Sleep for 10 milliseconds
    return f"Processed: {item}"
# --- Measurement ---
items_to_process = list(range(1000))
start_time = time.perf_counter() # Use perf_counter for highest precision
processed_count = 0
for item in items_to_process:
    process_item(item)
    processed_count += 1
end_time = time.perf_counter()
total_time = end_time - start_time
throughput = processed_count / total_time
print(f"Processed {processed_count} items.")
print(f"Total time: {total_time:.4f} seconds")
print(f"Throughput: {throughput:.2f} items/second")
Output:
Processed 1000 items.
Total time: 10.5123 seconds
Throughput: 95.12 items/second
(Note: The actual throughput will vary slightly each run due to system load and the precision of sleep).
Using the locust Library for Load Testing
For web APIs or network services, manually writing a test is cumbersome. locust is a powerful, easy-to-use Python library for load testing. It's specifically designed to measure throughput and other performance metrics under heavy simulated load.
First, install locust:
pip install locust
Example 2: Measuring Throughput of a Fake API
Let's create a simple web server with Flask and then test it with Locust.
Step 1: Create the server (server.py)
from flask import Flask, jsonify
import time
app = Flask(__name__)
@app.route('/api/data')
def get_data():
    # Simulate a task that takes 50ms
    time.sleep(0.05)
    return jsonify({"message": "Here is your data", "id": 1})
if __name__ == '__main__':
    app.run(port=5000) # Run on port 5000
Step 2: Create the Locust test file (locustfile.py)
from locust import HttpUser, task, between
class WebsiteUser(HttpUser):
    # Wait a random time between 1 and 5 seconds between requests
    wait_time = between(1, 5)
    @task
    def load_test_endpoint(self):
        # This task will be executed by each user
        self.client.get("/api/data")
Step 3: Run the test
-
Start the server:
python server.py
You'll see it running on
http://127.0.0.1:5000. -
Start Locust: Open a new terminal and run:
locust -f locustfile.py
-
Configure and Run the Test:
- Open your browser and go to
http://127.0.0.1:8089. - Set Number of users (e.g., 100).
- Set Spawn rate (e.g., 10 users/second).
- Click "Start swarming".
- Open your browser and go to
Step 4: Analyze the Results
Locust will provide a real-time dashboard. The most important metrics for throughput are:
- RPS (Requests per Second): This is your throughput. It shows how many requests your server is handling per second.
- Type: Shows if the request was a success (2xx) or a failure (4xx, 5xx).
- Response Time: Shows the average and max latency for your requests.
This gives you a clear, dynamic view of your system's performance under load.
Factors Affecting Throughput in Python
Improving throughput is about optimizing the entire pipeline. Here are the key factors:
| Factor | Description | How to Improve |
|---|---|---|
| CPU-Bound Tasks | Your program is limited by the speed of the CPU. Common in mathematical calculations, data compression, or image processing. | - Use Cython to compile critical parts of your code to C. - Use libraries like NumPy and Pandas which are optimized for performance. - Use multiprocessing to utilize multiple CPU cores. |
| I/O-Bound Tasks | Your program spends most of its time waiting for external resources like disk reads/writes, network requests, or database queries. | - Use asynchronous programming with asyncio and libraries like aiohttp for network operations.- Use threading for concurrent I/O operations (though beware of the GIL for CPU-bound work in threads). - Cache frequently accessed data to reduce I/O. |
| The Global Interpreter Lock (GIL) | In CPython (the standard implementation), the GIL is a mutex that protects access to Python objects, allowing only one thread to execute Python bytecode at a time. This prevents true parallelism on multi-core CPUs for CPU-bound tasks. | - Use multiprocessing (as mentioned above) to bypass the GIL. - For CPU-bound tasks, use alternative Python implementations like Jython or IronPython (if they fit your needs). |
| Algorithmic Complexity | The choice of data structure and algorithm has a massive impact. A poorly chosen algorithm can make even the fastest code slow. | - Use efficient data structures (e.g., set for fast lookups instead of a list).- Choose the right algorithm (e.g., use a hash table for O(1) lookups instead of a list for O(n)). - Profile your code to find bottlenecks. |
| External Dependencies | Slow databases, slow network APIs, or slow disk storage will bottleneck your entire application. | - Optimize database queries (use indexes, avoid SELECT *).- Use connection pooling for databases and HTTP clients.<br- Consider using a faster web server (e.g., Gunicorn with Uvicorn for async apps). |
Summary
- Throughput is work per time (e.g., items/sec).
- It's different from Latency, which is time per work (e.g., seconds/item).
- You can measure it manually with a timer and a counter.
- For web services,
locustis the industry-standard tool for measuring throughput under load. - To improve throughput, you must identify if your task is CPU-bound or I/O-bound and apply the right Python concurrency model (
multiprocessing,threading, orasyncio).