Of course! The term "tablepanel" isn't a standard, built-in Python module. It's a descriptive name, which is great because it tells us exactly what we need to build: a panel that displays a table.

I'll provide you with a comprehensive guide on how to create and use table panels in Python, covering the most popular and effective libraries for this task.
What is a Table Panel?
A "table panel" is a user interface component that displays data in a grid-like structure with rows and columns. It's one of the most common widgets in desktop and web applications for viewing, editing, and managing tabular data.
Here are the best ways to create table panels in Python, categorized by their use case:
-
For Desktop Applications (GUI):
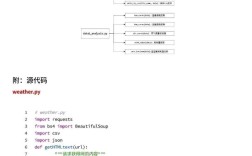
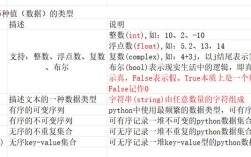
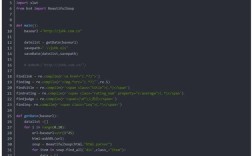
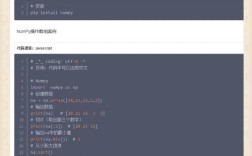
 (图片来源网络,侵删)
- Tkinter: Built-in, simple for basic tables.
- PyQt / PySide: Very powerful, feature-rich, and industry-standard.
- wxPython: Another robust, cross-platform GUI toolkit.
-
For Web Applications:
- Dash (by Plotly): Perfect for creating interactive, data-driven web apps with tables.
- Streamlit: Excellent for quickly building data apps with simple table components.
-
For Command-Line / Jupyter Notebooks:
- Pandas: The go-to library for data analysis, with excellent built-in display functions.
- Rich: A modern library for beautiful text and tables in the terminal.
Desktop GUI Applications
a) Using Tkinter (Simple & Built-in)
Tkinter is Python's standard GUI library. While it doesn't have a dedicated "TablePanel" widget, you can create one using the ttk.Treeview widget, which is surprisingly effective for displaying tables.
Key Features:

- Simple to set up.
- Good for read-only or simple editable tables.
- Part of Python's standard library (no installation needed).
import tkinter as tk
from tkinter import ttk
# --- Main Application Window ---
root = tk.Tk()"Tkinter Table Panel")
root.geometry("600x400")
# --- Data for the Table ---
data = [
    ("Alice", 28, "Engineer"),
    ("Bob", 34, "Designer"),
    ("Charlie", 45, "Manager"),
    ("Diana", 29, "Scientist"),
]
# --- Create the Treeview (Table) ---
# Define the columns
columns = ("name", "age", "occupation")
tree = ttk.Treeview(root, columns=columns, show="headings")
# Define the headings
tree.heading("name", text="Name")
tree.heading("age", text="Age")
tree.heading("occupation", text="Occupation")
# Add data to the table
for item in data:
    tree.insert("", tk.END, values=item)
# --- Add Scrollbars ---
# Vertical scrollbar
vsb = ttk.Scrollbar(root, orient="vertical", command=tree.yview)
tree.configure(yscrollcommand=vsb.set)
# Horizontal scrollbar
hsb = ttk.Scrollbar(root, orient="horizontal", command=tree.xview)
tree.configure(xscrollcommand=hsb.set)
# --- Layout the Widgets ---
tree.grid(row=0, column=0, sticky="nsew")
vsb.grid(row=0, column=1, sticky="ns")
hsb.grid(row=1, column=0, sticky="ew")
# Configure grid to expand with window
root.grid_rowconfigure(0, weight=1)
root.grid_columnconfigure(0, weight=1)
root.mainloop()
b) Using PyQt / PySide (Powerful & Feature-Rich)
PyQt and PySide (the official Python bindings for the Qt framework) provide a dedicated QTableView widget, which is the gold standard for tables in desktop applications.
Key Features:
- Extremely powerful and customizable.
- Supports sorting, filtering, and complex selection models.
- Can be made editable with ease.
- Installation:
pip install PySide6(orPyQt6)
import sys
from PySide6.QtWidgets import (QApplication, QMainWindow, QTableView,
                               QVBoxLayout, QWidget)
from PySide6.QtCore import QAbstractTableModel, Qt
# --- A Custom Model for the Table ---
class TableModel(QAbstractTableModel):
    def __init__(self, data):
        super().__init__()
        self._data = data
    def data(self, index, role):
        if role == Qt.DisplayRole:
            # Return the data for the correct row and column
            return self._data[index.row()][index.column()]
    def rowCount(self, index):
        return len(self._data)
    def columnCount(self, index):
        return len(self._data[0]) if self._data else 0
# --- Main Application Window ---
class MainWindow(QMainWindow):
    def __init__(self):
        super().__init__()
        self.setWindowTitle("PySide Table Panel")
        self.setGeometry(100, 100, 600, 400)
        # --- Data for the Table ---
        data = [
            ("Alice", 28, "Engineer"),
            ("Bob", 34, "Designer"),
            ("Charlie", 45, "Manager"),
            ("Diana", 29, "Scientist"),
        ]
        # --- Create the Table View ---
        self.table_view = QTableView()
        self.model = TableModel(data)
        self.table_view.setModel(self.model)
        # --- Set up the Layout ---
        layout = QVBoxLayout()
        layout.addWidget(self.table_view)
        container = QWidget()
        container.setLayout(layout)
        self.setCentralWidget(container)
# --- Run the Application ---
if __name__ == "__main__":
    app = QApplication(sys.argv)
    window = MainWindow()
    window.show()
    sys.exit(app.exec())
Web Applications
Using Dash (by Plotly)
Dash is fantastic for creating analytical web apps. Its dash_table component is specifically designed for displaying, styling, and interacting with dataframes.
Key Features:
- Interactive: sort, filter, edit, and export data.
- Integrates seamlessly with Pandas.
- Highly customizable with CSS.
- Installation:
pip install dash
import dash
from dash import html, dash_table
import pandas as pd
# --- Create a Pandas DataFrame ---
data = {
    'Name': ['Alice', 'Bob', 'Charlie', 'Diana'],
    'Age': [28, 34, 45, 29],
    'Occupation': ['Engineer', 'Designer', 'Manager', 'Scientist']
}
df = pd.DataFrame(data)
# --- Initialize the Dash App ---
app = dash.Dash(__name__)
# --- Define the App Layout ---
app.layout = html.Div([
    html.H1("Dash Table Panel"),
    # The dash_table component
    dash_table.DataTable(
        id='table',
        columns=[{"name": i, "id": i} for i in df.columns],
        data=df.to_dict('records'), # Convert DataFrame to list of dicts
        # Styling options
        style_table={'overflowX': 'auto'},
        style_cell={'textAlign': 'left', 'padding': '5px'},
        style_header={'backgroundColor': '#636e72', 'color': 'white', 'fontWeight': 'bold'},
        # Make it editable
        editable=True,
        sort_action="native", # Enables sorting
        filter_action="native" # Enables filtering
    )
])
# --- Run the App ---
if __name__ == '__main__':
    app.run_server(debug=True)
Command-Line & Jupyter Notebooks
a) Using Pandas (The Standard for Data)
Pandas is the cornerstone of data analysis in Python. Its DataFrame object has built-in methods to display itself beautifully in environments like Jupyter Notebooks or the terminal.
Key Features:
- The most natural way to work with tabular data in Python.
- Rich display options for notebooks.
- Installation:
pip install pandas
import pandas as pd
# --- Create a DataFrame ---
data = {
    'Name': ['Alice', 'Bob', 'Charlie', 'Diana'],
    'Age': [28, 34, 45, 29],
    'Occupation': ['Engineer', 'Designer', 'Manager', 'Scientist']
}
df = pd.DataFrame(data)
# --- In a Jupyter Notebook, just displaying the variable shows the table ---
# df
# --- In a standard Python script, you can print it ---
print("--- Basic Table ---")
print(df)
print("\n--- Table with Custom Formatting ---")
# You can use styling for better output in notebooks
# (This will also print nicely to the console)
styled_df = df.style.format({"Age": "{:.0f}"}).set_caption("Employee Information")
print(styled_df.to_string())
# --- For a more terminal-friendly table, use tabulate ---
# pip install tabulate
from tabulate import tabulate
print("\n--- Formatted with Tabulate ---")
print(tabulate(df, headers='keys', tablefmt='psql', showindex=False))
b) Using Rich (Beautiful Terminal Tables)
The rich library makes it easy to create beautiful, readable tables in your terminal. It's perfect for CLI tools and scripts.
Key Features:
- Produces beautifully styled tables with colors and borders.
- Easy to use.
- Installation:
pip install rich
from rich.console import Console
from rich.table import Table
# --- Create a Rich Table ---
console = Console()
table = Table(title="Employee Information")
# Add columns
table.add_column("Name", style="cyan", no_wrap=True)
table.add_column("Age", style="magenta")
table.add_column("Occupation", justify="center", style="green")
# Add rows
data = [
    ("Alice", 28, "Engineer"),
    ("Bob", 34, "Designer"),
    ("Charlie", 45, "Manager"),
    ("Diana", 29, "Scientist"),
]
for row in data:
    table.add_row(*map(str, row))
# Print the table to the console
console.print(table)
Summary: Which One Should You Choose?
| Use Case | Recommended Library | Why? |
|---|---|---|
| Simple Desktop App | Tkinter | Built-in, easy for basic needs, no extra dependencies. |
| Professional Desktop App | PyQt / PySide | Most powerful, feature-rich, and customizable. Industry standard. |
| Interactive Web App | Dash | Purpose-built for data apps. Integrates with Pandas and Plotly. |
| Data Analysis / Jupyter | Pandas | The standard. Seamless data manipulation and display. |
| Beautiful CLI Output | Rich | Makes terminal output stunningly beautiful and readable. |